
A predictable outcome is one of the most sought-after goals in any business or initiative. It’s easy to see why.
We often correlate predictability with attractive benefits like lower risk, higher business value, and maybe even less stress. So with every new project, we dutifully gather time, effort, and resource estimates from all involved — hoping that this time we’ll nail it.
Except we rarely do.
Fact-Based Predictability with Lean Metrics
Predictability metrics help teams make more accurate estimates about the completion and consistency of their work items. This can lead to better work prioritization and more targeted communications among stakeholders.
“If you can make decisions based on facts rather than forecasts, you get results that are more predictable. Lean development is the art and discipline of basing commitments on facts rather than forecasts.”
— Mary Poppendieck, Lean Development and the Predictability Paradox (2003)
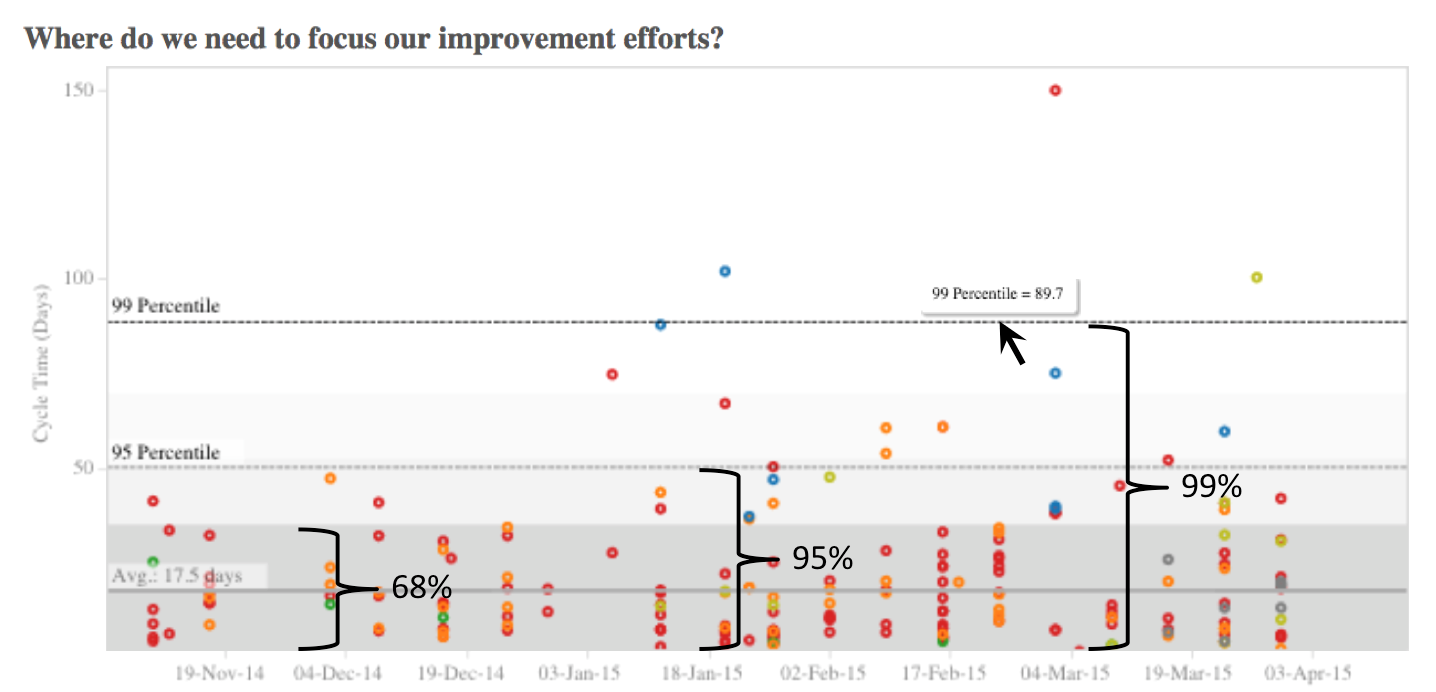
Teams can use a process control chart to graphically represent their cycle time and completion consistency. The Planview AgilePlace-generated chart above plots a team’s recent work items based on their cycle time. (Note: In this instance, cycle time refers to how many days it took to finish a work item.)
In addition to showing the team’s average cycle time (17.5 days), the chart includes three standard deviations to help predict if the team will complete a work item within a certain timeline:
- 68% of the time, the team will finish a work item within 35.5 days.
- 95% of the time, the team will finish a work item within 54.5 days.
- 99% of the time, the team will finish a work item within 89.7 days.
The key to using a predictability chart is to take the range of possible delivery dates and apply them to your team’s work. Then, when you’re asked to provide an estimate of how long something will take, you can turn to the chart — instead of making an arbitrary guess. With about 70% certainty, you can say that your team can finish a work item in about 36 days. For a higher level of certainty, you know you need to start a work item about 55 days before it must be delivered. In contrast to estimates, using historical date ranges can give teams and their stakeholders a more realistic view of their anticipated cycle time.
Using Predictability Metrics for Continuous Improvement
In addition to more confident timelines, teams can use predictability charts for continuous improvement. For example, data points that fall inside the range of three standard deviations (99% confidence) are often referred to as being “in control.” In-control data points influence the bulk of our day-to-day improvement efforts. We can use them to improve predictability by reducing the range of outcomes.
Using the chart shown above, again: If we can get our 95% confidence interval down from 55 to 45 days, we’ll get a major improvement in predictability. We can then be more confident in the commitments we make to stakeholders regarding delivery of valuable work. Ways to achieve this include limiting our work-in-process, spending more time analyzing and breaking down work items into smaller chunks, or working to automate recurring processes.
It can also be useful to analyze the data points that lie outside the range of three standard deviations in a predictability chart. These points are considered “out of control,” but they’re excellent candidates for team retrospectives, lean coffees, or a root cause analysis. Investigating them can help you find ways to improve.
The Bottom Line
Predictability metrics can help improve accuracy by injecting facts into your analysis. Using completion consistency charts allows you to make more realistic predictions about the prospective outcomes of work items entering your system. This metric can help you measure the effect of your improvement efforts and allow you to confidently commit to reasonable timelines based on facts, not estimates.
Recommended Reading
- 7 Lean Metrics to Improve Flow
- Kanban: How to Get Started with Continuous Improvement (includes four Kanban metrics that any team can track)
- Enhanced Lean Metrics: More Speed and Insight
![A Global Collaborative Work Management Blueprint [Video]](https://blog.planview.com/wp-content/uploads/2019/07/A-Global-Collaborative-Work-management-blueprint.png)