A picture’s worth a thousand words — unless, of course, it conveys outdated or incomplete data. With Planview AgilePlace’s new Custom Reporting, you can answer your burning questions faster — and more accurately.
AgilePlace’s Custom Reporting solution offers quick insight to help you:
- Highlight organizational trends withcross-board reporting
- Meet your unique needs with custom reports, charts, and graphs
- Ensure common understanding via easy report sharing
Exclusively available to our Advanced and Enterprise Edition customers, Planview AgilePlace’s Custom Reporting provides a consolidated, repeatable, visual map to all of your project and portfolio data. Used alongside Planview AgilePlace’s in-app reporting, this new functionality helps you paint an accurate picture of your business reality.
Visual Reporting
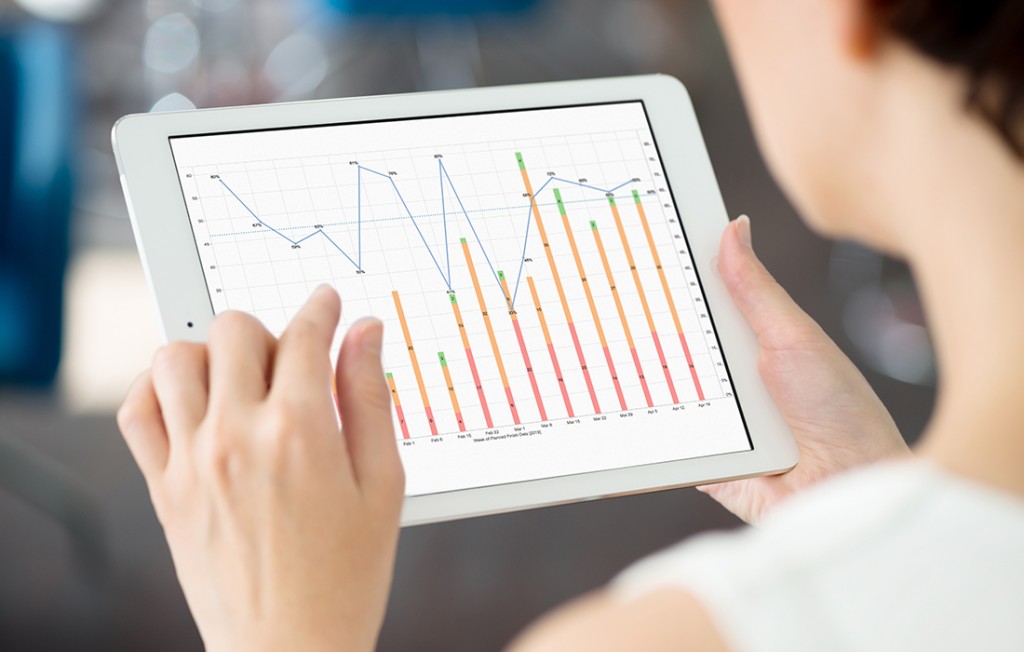
Rows and columns may contain vital raw data but not in a way you can readily understand. Planview AgilePlace’s Custom Reporting allows you to create visual summary dashboards that help you understand any existing data set. Pre-loaded reports provide quick insights into important data points. Cross-organization rollup reporting allows you to highlight trends across multiple teams, departments, or organizational levels. You can also use Custom Reporting to analyze trends in historical data in order to make more informed decisions for your organization’s continuous improvement efforts.
Your Data, Your Way
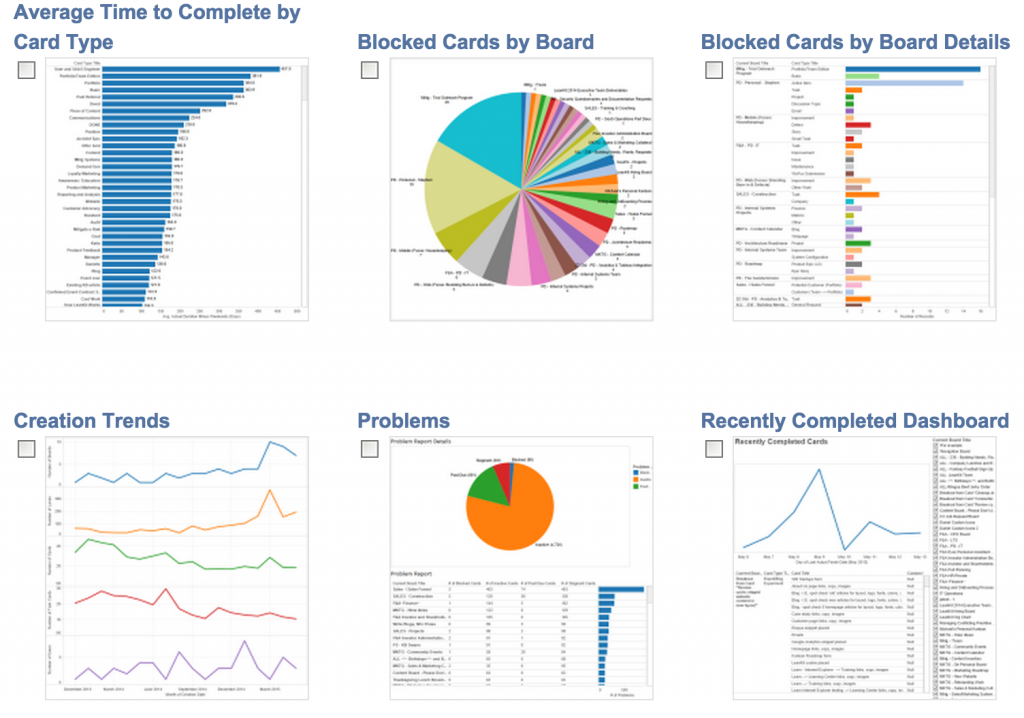
Whether you need to assess the health of your portfolio or drill into detailed project statistics, it’s easy to create the right reports, charts, and graphs to meet your unique reporting needs. Intuitive report authoring with immediate data sharing and extraction allows you to easily visualize progress, performance, variances, and trends. The customization options are endless — offering interactive filtering and tagging to highlight specific data sets, so you can dive into data-driven opportunities.
Armed with Insight
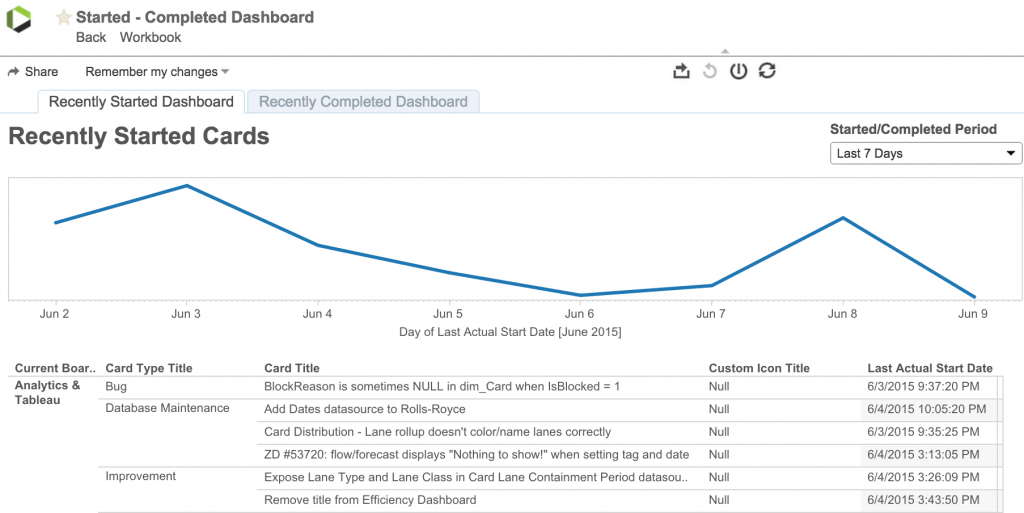
With Custom Reporting, Planview AgilePlace arms your entire team with relevant, up-to-date, and understandable insights. Get everyone on the same page with continuous data refreshes to visualize the most relevant information. Image, crosstab, and PDF views make it easy to download and share valuable, digestible data. Get the insights you need to enable collaboration and support overall business strategy decisions with just a few clicks.
Planview AgilePlace Custom Reporting provides you with a consolidated, repeatable, visual map to all of your project and portfolio data so you can spend less time generating reports and more time doing what you enjoy — solving problems and making improvements.
Interested in learning more about Custom Reporting? For more information about our product editions, please visit our pricing page, and request a demo to see this reporting in action.
![A Global Collaborative Work Management Blueprint [Video]](https://blog.planview.com/wp-content/uploads/2019/07/A-Global-Collaborative-Work-management-blueprint.png)