
The part 1 of this series, 5 Lean and Agile Metrics to Measure Track with Your Team: Lead Time and Cycle Time, I shared two of the five Lean and Agile metrics to track. In this blog, we’ll talk about measuring batch size, WIP, and throughput. Let’s get started.
The goal for any Agile team is to reach a state of continuous delivery. This requires teams to eliminate the traditional start-stop-start project initiation and development process, and the mentality that goes along with it. How do teams accomplish this? By actively controlling their batch sizes.
BATCH SIZE: HOW MUCH WORK ARE WE AIMING TO COMPLETE DURING THIS SPRINT?
What It Is: How many work items, or the total size of work, being pulled in at the start of each sprint.
How It’s Measured: Estimated level of effort, measured by story point sizes, number of work items, etc.
What It Tells Us: What we think our capacity is for any given period, which is valuable for creating realistic estimates during roadmap planning.
Batch size is a measure of how much work—the requirements, designs, code, tests, and other work items—is pulled into the system during any given sprint. In Agile, batch size isn’t just about maintaining focus—it’s also about managing cost of delay. Small batches go through the system faster and with less variability than larger batches. They also foster faster learning—the faster you can get something out the door and see how your customer reacts to it, the faster you can incorporate those learnings into future work.
WIP: HOW MUCH ARE WE WORKING ON RIGHT NOW?
What It Is: A snapshot metric that shows how many work items are actively being worked on at any given time.
How It’s Measured: Teams using Kanban boards can see WIP by counting how many cards are currently in their active/in process/doing board lanes (digital boards are able to measure this automatically).
What It Tells Us: Knowing this number over time helps to highlight whether a team is starting work items before finishing existing WIP (aka creating a push-based system instead of the desired pull-based system).
While batch size tells us how much work we’re trying to do in a sprint, WIP (work in progress) tells us how much work we’re actively working on at any given moment.
Why does this matter? If the goal of any team is to work together to get things done, but everyone is working on different things, collaboration becomes a competitive sport. Rather than working collaboratively to move tasks through the system as quickly as possible, team members compete for each other’s time, energy, and attention, creating a system that becomes stuck in its own inefficiency.
Having too much work in progress can lead to handoff delays, excessive meetings, context switching, duplicate work, and other wastes that can be avoided with just a little more discipline (learn more about why we need WIP limits here). Actively, as a team, reviewing how much work is in progress, and discussing what can be done to move that work through before pulling new work in can help to alleviate a lot of the tension that many teams experience.
Like with batch sizes, finding an ‘optimal’ level of WIP for each team is a process. There’s no formula to determine the precise number of WIP that is appropriate for any team—it varies depending on the size and speed of your team, the efficiency of your process, the complexity and variability inherent to the work, etc.
Once you determine a realistic, but challenging goal for your team’s current WIP, you can set a WIP limit. Setting WIP limits can be especially helpful for teams who tend to feel overwhelmed, overworked, or disconnected from each other.
Setting WIP limits forces teams to talk about not only the work itself, but when and how you pull new work into the system and how each team member’s actions affect the system as a whole. It’s a challenging but transformative practice that can greatly impact a team’s performance over time (here’s an exercise for getting started with WIP limits on your team).
THROUGHPUT (VELOCITY) AND LITTLE’S LAW:
What It Is: A measure of how many work items are completed in a particular time unit.
How It’s Measured: On a Kanban board—cards per day, cards, per week, etc.
What It Tells Us: How efficiently the team is completing work; demonstrates how adding more work to the system might impact cycle time.
Throughput (sometimes called velocity) is the average number of units processed per time unit. In an Agile system, examples can include “cards per day,” “cards per week,” or “story points per iteration.”
Measuring throughput can be very useful for forecasting, especially after a fair amount of data has been collected (over several sprints). Since throughput reports track the forecasted and completed work over several iterations, the more iterations, the more accurate the forecast.
Product managers/owners can use throughput to predict how quickly a team can work through its current backlog (e.g., “Are we going to finish the items on the board by the end of the current sprint?”).
Since development work includes plenty of variability, throughput is important to track and define according to what impacts your workflows. Take a moment to consider what your definition of throughput—cards per day, cards per week, etc.—means in the context of your team’s work. Don’t forget to consider the effect of outliers in your measurement, as one significant event can drastically change the entire average. It is most effective to view throughput either as a trend or by combining it with other metrics, such as cycle time and lead time, to get a holistic picture of your team’s capacity and productivity.
Related to throughput is Little’s Law, a hypothetical formula that can be used to demonstrate how changes made to the system’s input can impact the system’s output.
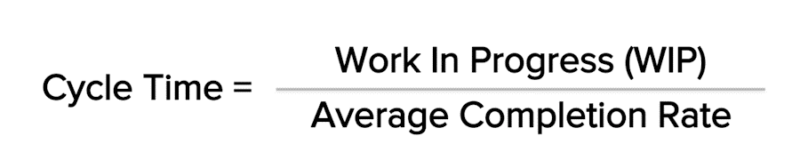
Cycle time formula.
For example, if a team has 25 cards in process (i.e., their total WIP) and a throughput of 1.5 cards/day, then the average cycle time is 16.66 days. If the same team maintains the same throughput but increases its total WIP to 40 cards, the average cycle time becomes 26.66 days. Little’s Law can be valuable to show how reducing WIP can reduce cycle time. You can also improve cycle time by increasing throughput, although this is much more difficult to do than reducing the total WIP.
ONWARDS AND UPWARDS!
It’s worth mentioning once more that metrics are not universally helpful—whenever you decide to start reporting on any metric, be sure to ask yourself: Why? Why does this metric matter? What goal is this helping us achieve?
Aim to always approach reporting with openness and curiosity—looking to learn new things, not confirming what you already know.
Use Lean and Agile metrics to identify issues and highlight opportunities for improvement, not to punish anyone, prove a point, or achieve any other personal ambitions. Lean and Agile metrics should be your friends, tools to help your team evolve into a more efficient, more collaborative, and ultimately, healthier system. Use Lean and Agile metrics for good, not evil, and you’ll see your team achieve great things.
Luckily, if you’re already practicing Kanban, you are already generating data that will give you insights into how to improve your Lean and Agile workflow. If you aren’t, I encourage you to go through the exercises in the Kanban Roadmap with your team. Once you have a board that accurately reflects your current process, you’ll have everything you need to begin your team’s evolution. Introducing Lean and Agile metrics can breathe new life into a team, rallying everyone around the opportunity to work smarter, get more done, and stress less. Happy reporting!
![A Global Collaborative Work Management Blueprint [Video]](https://blog.planview.com/wp-content/uploads/2019/07/A-Global-Collaborative-Work-management-blueprint.png)